NASH: Concurrent Fibrosis and Fat Imaging and Quantification
In the particular case of NAFLD and NASH, we concurrently acquire SHG (collagen) and 2PE (tissue morphometrics and inflammation) images from the same unstained FFPE section, which is returned undamaged for further molecular pathology tests if needed.
See 2017 publications on our website page here.

Our image Analysis tools concurrently quantify fibrosis and Microvesicular Steatosis: Fibrosis is quantified using the Second Harmonic Generation (SHG) channel, both in terms of Content and structure. Steatosis is quantified using the Two-Photon excitation Fluorescence (2PE) channel: we extract and quantify the microvesicular and macrovesicular features. Vascular features (also "round and dark") are excluded as they are surrounded by collagen (identified by SHG) and often contain internal 2PE fluorescent from hemoglobin.
In 2018, both Fibrosis and the NAS-activity score can potentially become fully automated. Subscribe here if you are interested to stay informed of our progress.

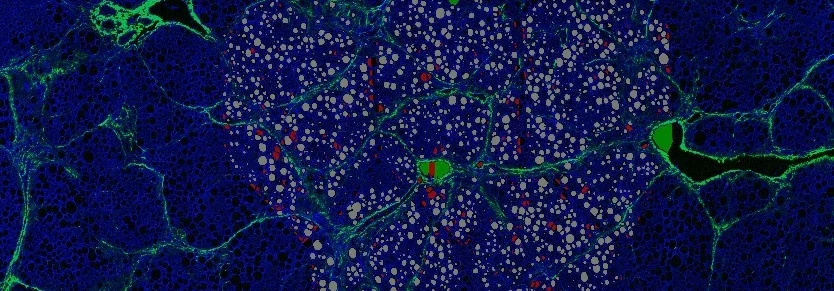
Rodent fed with Fatty Diet exhibit the development of fibrosis (in green, SHG imaging) and fat (dark circular vesicules on the 2PE red image) of increasing severity vs diet duration (above). Such images can be post-processed to extract a % Collagen Area (SHG image) and a % Fat Area % ( Extracted from the vesicules), showing good correlation with Hepatic Triglicerides (ref: W. Liang, 2015. PhD Dissertation, Establishment of a General NAFLD Scoring System for Rodents Models and Comparison to Human Liver Pathology - Chapter 2 - Link here)

Concordance with conventional Histopathology


In this case Study (Fat Diet NASH Mouse model N=4, vs Drug A and Drug B candidates, N=4) we highlight the combined efficacy of the drug candidates as anti-steatotic and and-fibrotic compounds. Dots are the group averages. Our method uses ONE FFPE slide to derive all the information. Turnaround time is les than 2 weeks for a typical 4 arms x 4 animals study.
Fibrosis Morphometric Phenotyping establishes pre-clinical continuous scores to assess the severity and progression of fibrosis.

Towards a fully automated, robust and continuous scoring of Fibrosis (in NASH)

Quantitative Morphometric Analysis of Fibrosis features (qFP: quantitative Fibrosis Parameters) enables the construction of a Fibrosis Composite Score that evolves continuously as fibrosis Progress,and can be used effectively as a Clinical Tool to assess Fibrosis
Ref: DUAL PHOTON MICROSCOPY BASED QUANTITATION OF FIBROSIS-RELATED PARAMETERS (Q-FP) TO MODEL DISEASE PROGRESSION IN STEATOHEPATITIS Yan Wang MD PhD, Hepatology doi: 10.1002/hep.29090
Is Fibrosis Morphometric Phenotyping a novel tool for patient classification ?
Early result support the hypothesis that there are multiple forms of fibrosis and that the related fibrosis phenotypes are very heterogeneous. The case study (below) shows that our morphometric phenotyping tools can classify pediatric patients with NASH-1 and NASH-2 forms, two well described forms of NASH. Further validation studies are on-going. We welcome investigator initiated study proposals in this field.
