Stain Free Collagen Imaging and Quantification
We provide services to image and quantify fibrosis in several organs, both for pre-clinical and clinical applications. Our projects range from 5 to 10 slides exploratory projects to 100 / 150 tissue studies for anti-fibrotic compounds screening or validation, or patient tissue characterization. We can do routine biopsy quality control (pre-biobanking) or fibrotic animal model quality assurance (pre-study biopsy and fibrosis quantification).
We welcome typical non-stained FFPE - 5 micron - or frozen section slides, which are returned after the study for further characterization (usually biochemistry).
Our expertise includes LIVER models (TAA, CCl4, BDL, Fat Diets, AMILIN, MDR2 etc), LUNG IPF models (Bleomycin), KIDNEY Models (UUO) and GI Models
How to prepare the samples before shipping?
Find the answer in this document
Step 1: Imaging
High Resolution Second Harmonic Generation (SGH) is a gold standard to image non centro-symmetric molecules like Collagen I and Collagen III specifically.
Label Free Two Photon intrinsic fluorescence (2PE) is the second optical method used to image cellular-level components, such as NADPH which translates to mitochondrial / cell health.
Genesis is is a mid-throughput fully automated imaging system (10 slides per batch) to image both Collagen (SHG) and NADPH (2PE) in high resolution in 2D and 3D (0.4x0.4x1 micron at 20X).
Tissues are prepared following conventional pathology protocols (5 micron sections of FFPE blocs) or frozen sections. For 3D, we can use 50 to 300 microns-think tissues.
In Low Resolution for web:
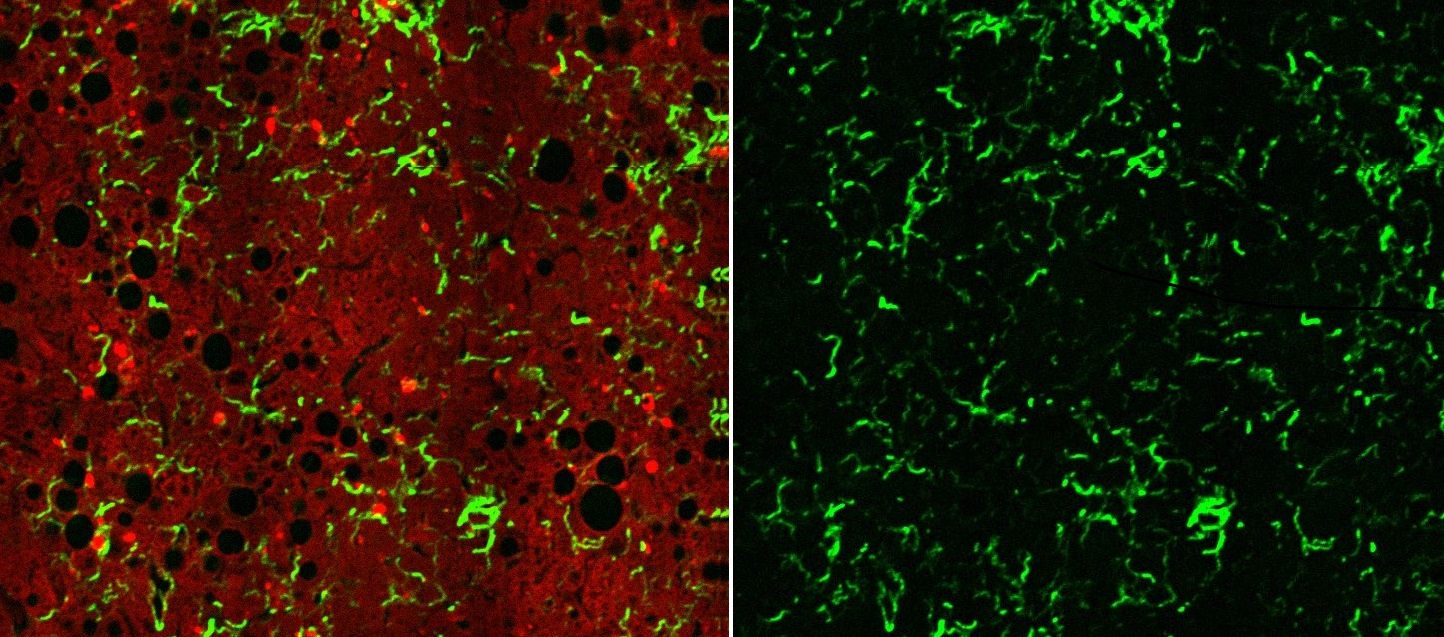
Left : NASH Liver Model shows collagen strings (green, SHG) overlapping the Fluorescence Signal from NADPH (cells).
Right : the corresponding SHG / collagen image alone, that offers a great deal of information on the collagen content and structure, which is later quantified by our tools.
Side by side comparison of SHG & 2PE imaging of non-strained 5 micron FFPE slide with conventional PSR staining. Credits to Beth Israel Deaconess Medical Center, 2016.
Step 2: Image Analysis and quantification
Each image analysis algorithm is tissue/dependent. See our pipeline here.
Images are treated with clinically validated algorithms to quantify the amount and features of Collagen, including Total Collagen, Distributed Collagen, strings count and topological distributions including nodes/cross links. Our algorithms are "machine learning" with pathologists inputs and then validated against conventional stained and quantified H&E images.
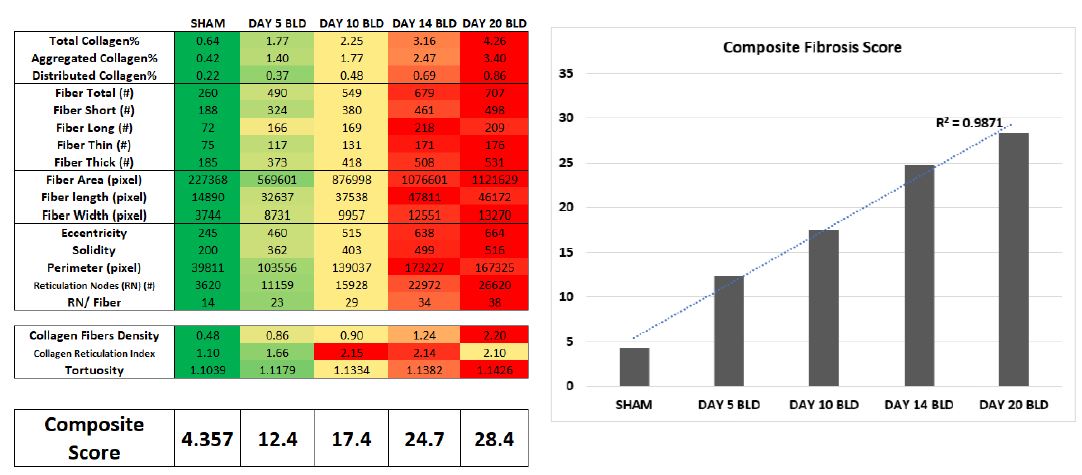
Morphometric Phenotyping generates robust and continuous scores to quantify the severity and progression of fibrosis, with a quality that exceeds histopathology methods
As shown below, the progression and severity of the BLD injury in an animal model is described using +15 different morphometric descriptors that increase as fibrosis progress. A composite score is generated to linearize the rate of progression (figure below, N=5 in each group), or to enhance the dynamic range in specific fibrosis severity regions ( “F3-4” for instance).
Applications to Drug Discovery
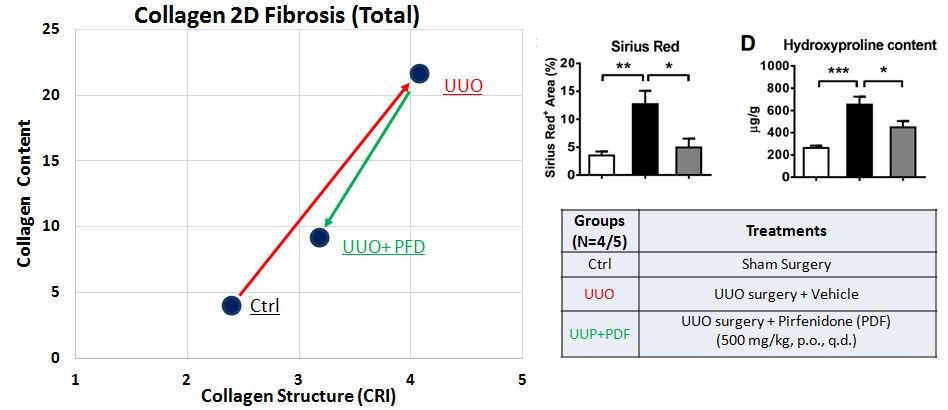
As shown below, antifibrotic drug candidates are easily evaluated using our 2DFibrosis Charts. They summarize the effect of a compound on both the collagen content (Collagen Fibers Area% or even better our Collagen Fiber Density %) and the collagen matrix structure (Collagen Network Reticulation Index or Collagen Reticulation Density), with robust data obtain with N=4 or 5 only.
The Antifibrotic effect of Pirfenidone on a CCl4 Rodent Model is easily show on our 2DFibrosis Chart ( above). The data is extracted from our SHG Images (below). Credits: Genesis Imaging Service and GenScript, 2016.

Composite Scores are used to quantify the effect of an antifibrotic compound with a performance that exceeds current histopathology methods (Figure Below, TAA rodent model, N=5 in each group, Compound anonymized)

LUNG Fibrosis Imaging and Quantification
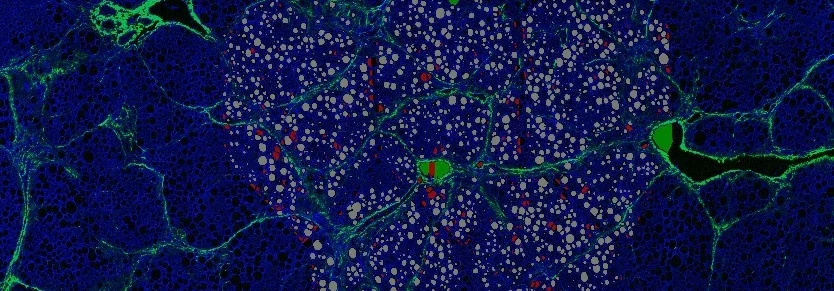
Our machine-learning algorithms are able to automatically identify the three main functional areas of the lung : the "lesional" or "Inflamatory" areas ( in red below), the "Parenchymal" or "functional" areas ( in blue below) and the "Structural" areas (in green). The segmentation of these regions is automatic and the algorithms are based on the analysis of the texture of the collagen matrix, and have been trained by pathologists.

IPF Bleomycin mouse lung model at 20 days
In each region, we routinely quantify collagen content and collagen structure (including collagen fibers reticulation index - CRI), as well as a plethora of fibers morphometrics. With both Collagen content and Collagen structure information, we can stratify the fibrosis on our 2DFibrosis Charts, which are very practical tools to study the effect of a compound and / or stratify study groups as shown below:
The full study, including comparison to conventional Fibrosis outcomes is presented here.
Credits: Genesis Imaging Services and GenScript, May 2016
KIDNEY Fibrosis Imaging and Quantification
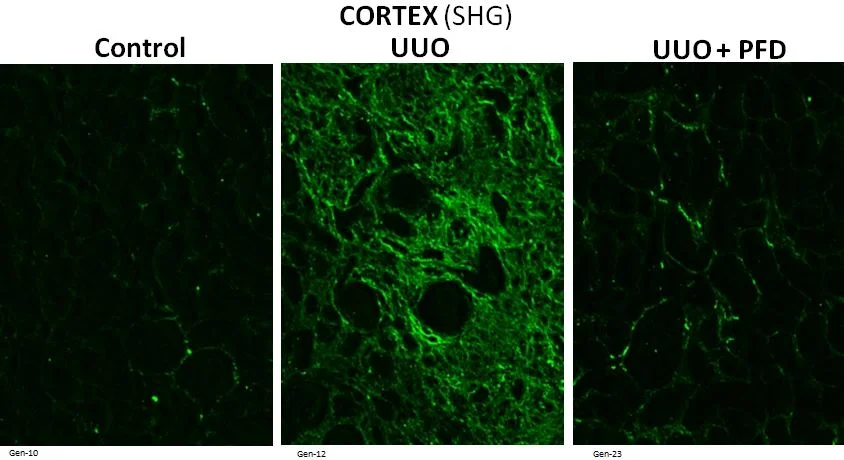
As for Lung/IPF, our machine-learning algorithms identify the cortical and medulla regions on a typical Kidney "wedge" biopsy. In each region, collagen content and collagen structure / reticulation are automatically quantified, and can also be displayed on our 2D fibrosis Charts (see below the progression of Fibrosis on a Kidney UUO Model from Day 0 to Day 28). Such capabilities are not limited to "wedge"biopsies: they can be performed on any kid of tissue, including human frozen sections biopsies.
Additional custom quantification capabilities can be developed, for instance to evaluate and substantiate a mechanism of action.
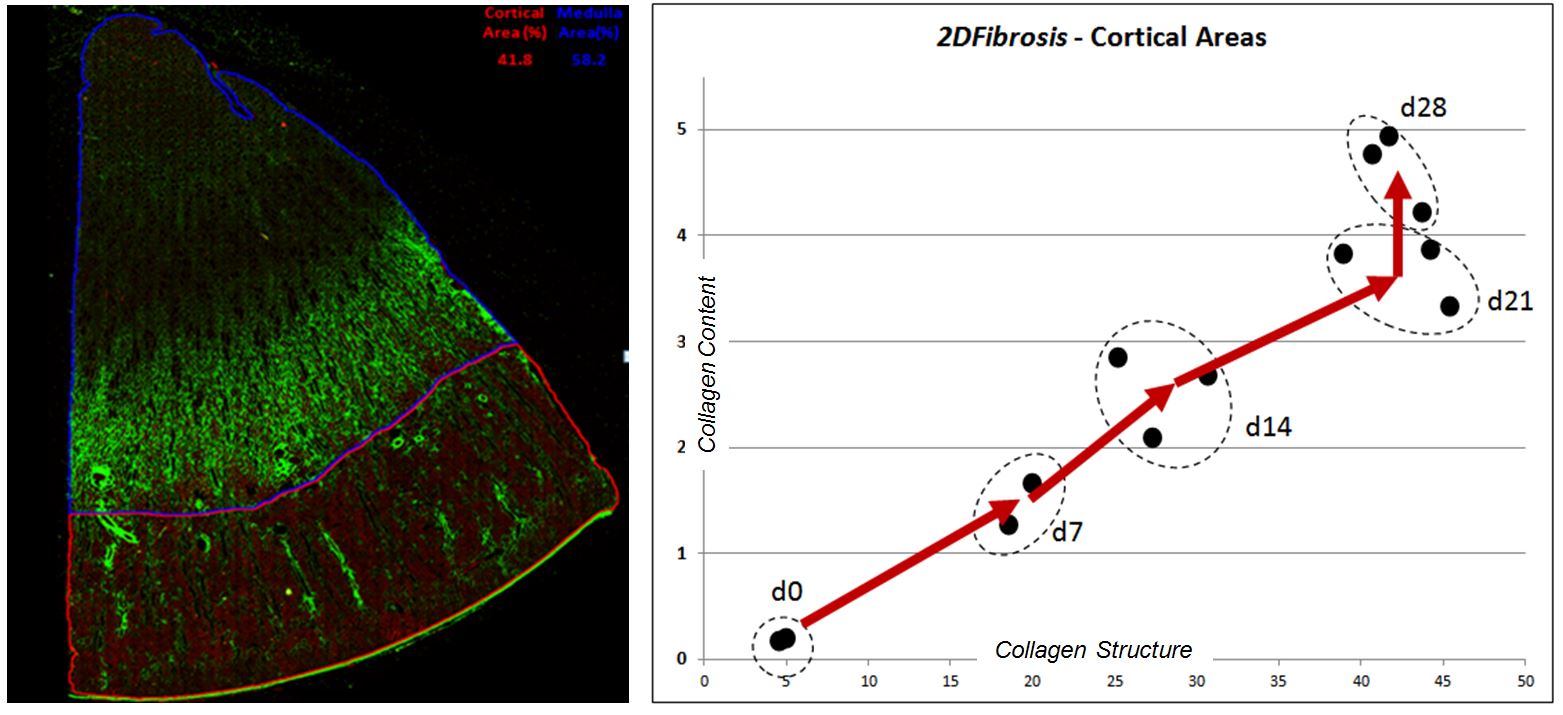
Credits : HistoIndex, A*Star Singapore, Genesis Imaging Services, May 2016
The full study, including comparison to conventional Fibrosis outcomes is presented here.
Credits : GenScript, A*STAR Singapore, Genesis Imaging Services, September 2016
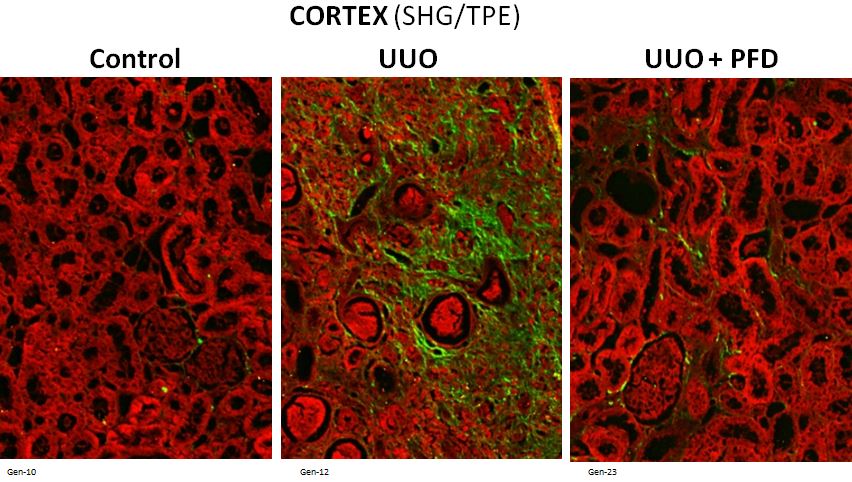
Above: SHG and 2PE imaging (20X) of the Cortex Region in a mouse UUO Model, at different Stages ( stdy describe above)
Below: Corresponding SHG Image, showing the sensitivity and level of details of our imaging methods. Hypothesis-driven imaging tools can be applied to substantiate specific MOA.